

Atacama Soil Microbiome#
These chapters demonstrate the QIIME2 plugins for high-dimensional statistics on the Atacama soil microbiome dataset [D1]. q2-gglasso solves a range of graphical lasso problems to identify microbial associations, and q2-classo assesses those associations by fitting sparse log-contrast models. The sequence data were processed under QIIME 2 version 2026.7 [S1]: the q2-demux plugin demultiplexed and quality-filtered the raw reads, DADA2 [D2] denoised them through the q2-dada2 plugin, and the q2-feature-classifier [S4] assigned taxonomy to the amplicon sequence variants (ASVs) with a naive Bayes classifier trained on the Silva database [D3].
Data preprocessing pipeline#
Preprocessing follows the published Atacama tutorial. To give these ASVs meaningful names, this book renames the ASV keys as follows:
ASV label |
Real ASV ID |
|---|---|
ASV-1 |
89cb1ddf89dcf11d86f725dbcaa9a5ce |
ASV-2 |
cdb9c0ee3bba4c3d8b9292eb575bd9e3 |
ASV-3 |
4c8ff0ea98d2c0ebb486e33bd96c61f9 |
ASV-4 |
a56b903521b8ab33a7878b35582803a8 |
ASV-5 |
5c78314ff92e6fec9aa07acc1fa0dc24 |
ASV-6 |
dc8a2f47b3d1dc2e1f5f805891976b29 |
ASV-7 |
6b780e361cfc5f06def718518324bdcb |
ASV-8 |
f6c10a04d57159c0d64d6bc30c677471 |
ASV-9 |
ffd60d684f32e6fd5b47fe90095f9d34 |
ASV-10 |
ef3fdbe1dcde754d91130cde6a4b4d61 |
ASV-11 |
a36b38f754f6abd278aeb9dbc7696343 |
ASV-12 |
a7b877ae6d2f079a15b6b192a4425620 |
ASV-13 |
409faa5f5353e543bf6d99125c7c0e83 |
Data for downstream analysis#
The Atacama soil microbiome dataset [D1] supplies:
50 samples from Atacama Desert soil
13 microbial taxa (ASVs)
Environmental covariates: pH, elevation, temperature, humidity and vegetation
The original data is available through the European Nucleotide Archive under accession ERP019482.
Sample ID |
ASV-1 |
ASV-2 |
ASV-3 |
… |
ASV-11 |
ASV-12 |
ASV-13 |
Elevation |
pH |
Avg Soil RH |
Avg Soil Temp |
Vegetation |
|---|---|---|---|---|---|---|---|---|---|---|---|---|
BAQ2420.1.1 |
0.0 |
11.0 |
0.0 |
… |
115.0 |
0.0 |
0.0 |
2420 |
9.33 |
82.54 |
22.45 |
no |
BAQ2420.1.2 |
0.0 |
0.0 |
0.0 |
… |
0.0 |
0.0 |
0.0 |
2420 |
9.36 |
82.54 |
22.45 |
no |
BAQ2420.1.3 |
0.0 |
0.0 |
0.0 |
… |
0.0 |
0.0 |
0.0 |
2420 |
8.90 |
82.54 |
22.45 |
no |
… |
… |
… |
… |
… |
… |
… |
… |
… |
… |
… |
… |
… |
YUN3856.2 |
6.0 |
13.0 |
26.0 |
… |
0.0 |
0.0 |
104.0 |
3856 |
7.43 |
99.44 |
9.51 |
yes |
YUN3856.3 |
21.0 |
36.0 |
23.0 |
… |
33.0 |
0.0 |
0.0 |
3856 |
7.43 |
99.44 |
9.51 |
yes |
The table above is a snapshot of the counts. Download the QIIME2 artifact and the matching metadata.
Covariates and missing values#
Four numeric covariates accompany these samples — pH, elevation, average soil relative humidity and average soil temperature. They are the outcomes and the adjustment variables in the log-contrast regression chapters, and the latent components in Latent Components & Covariates are tested against them.
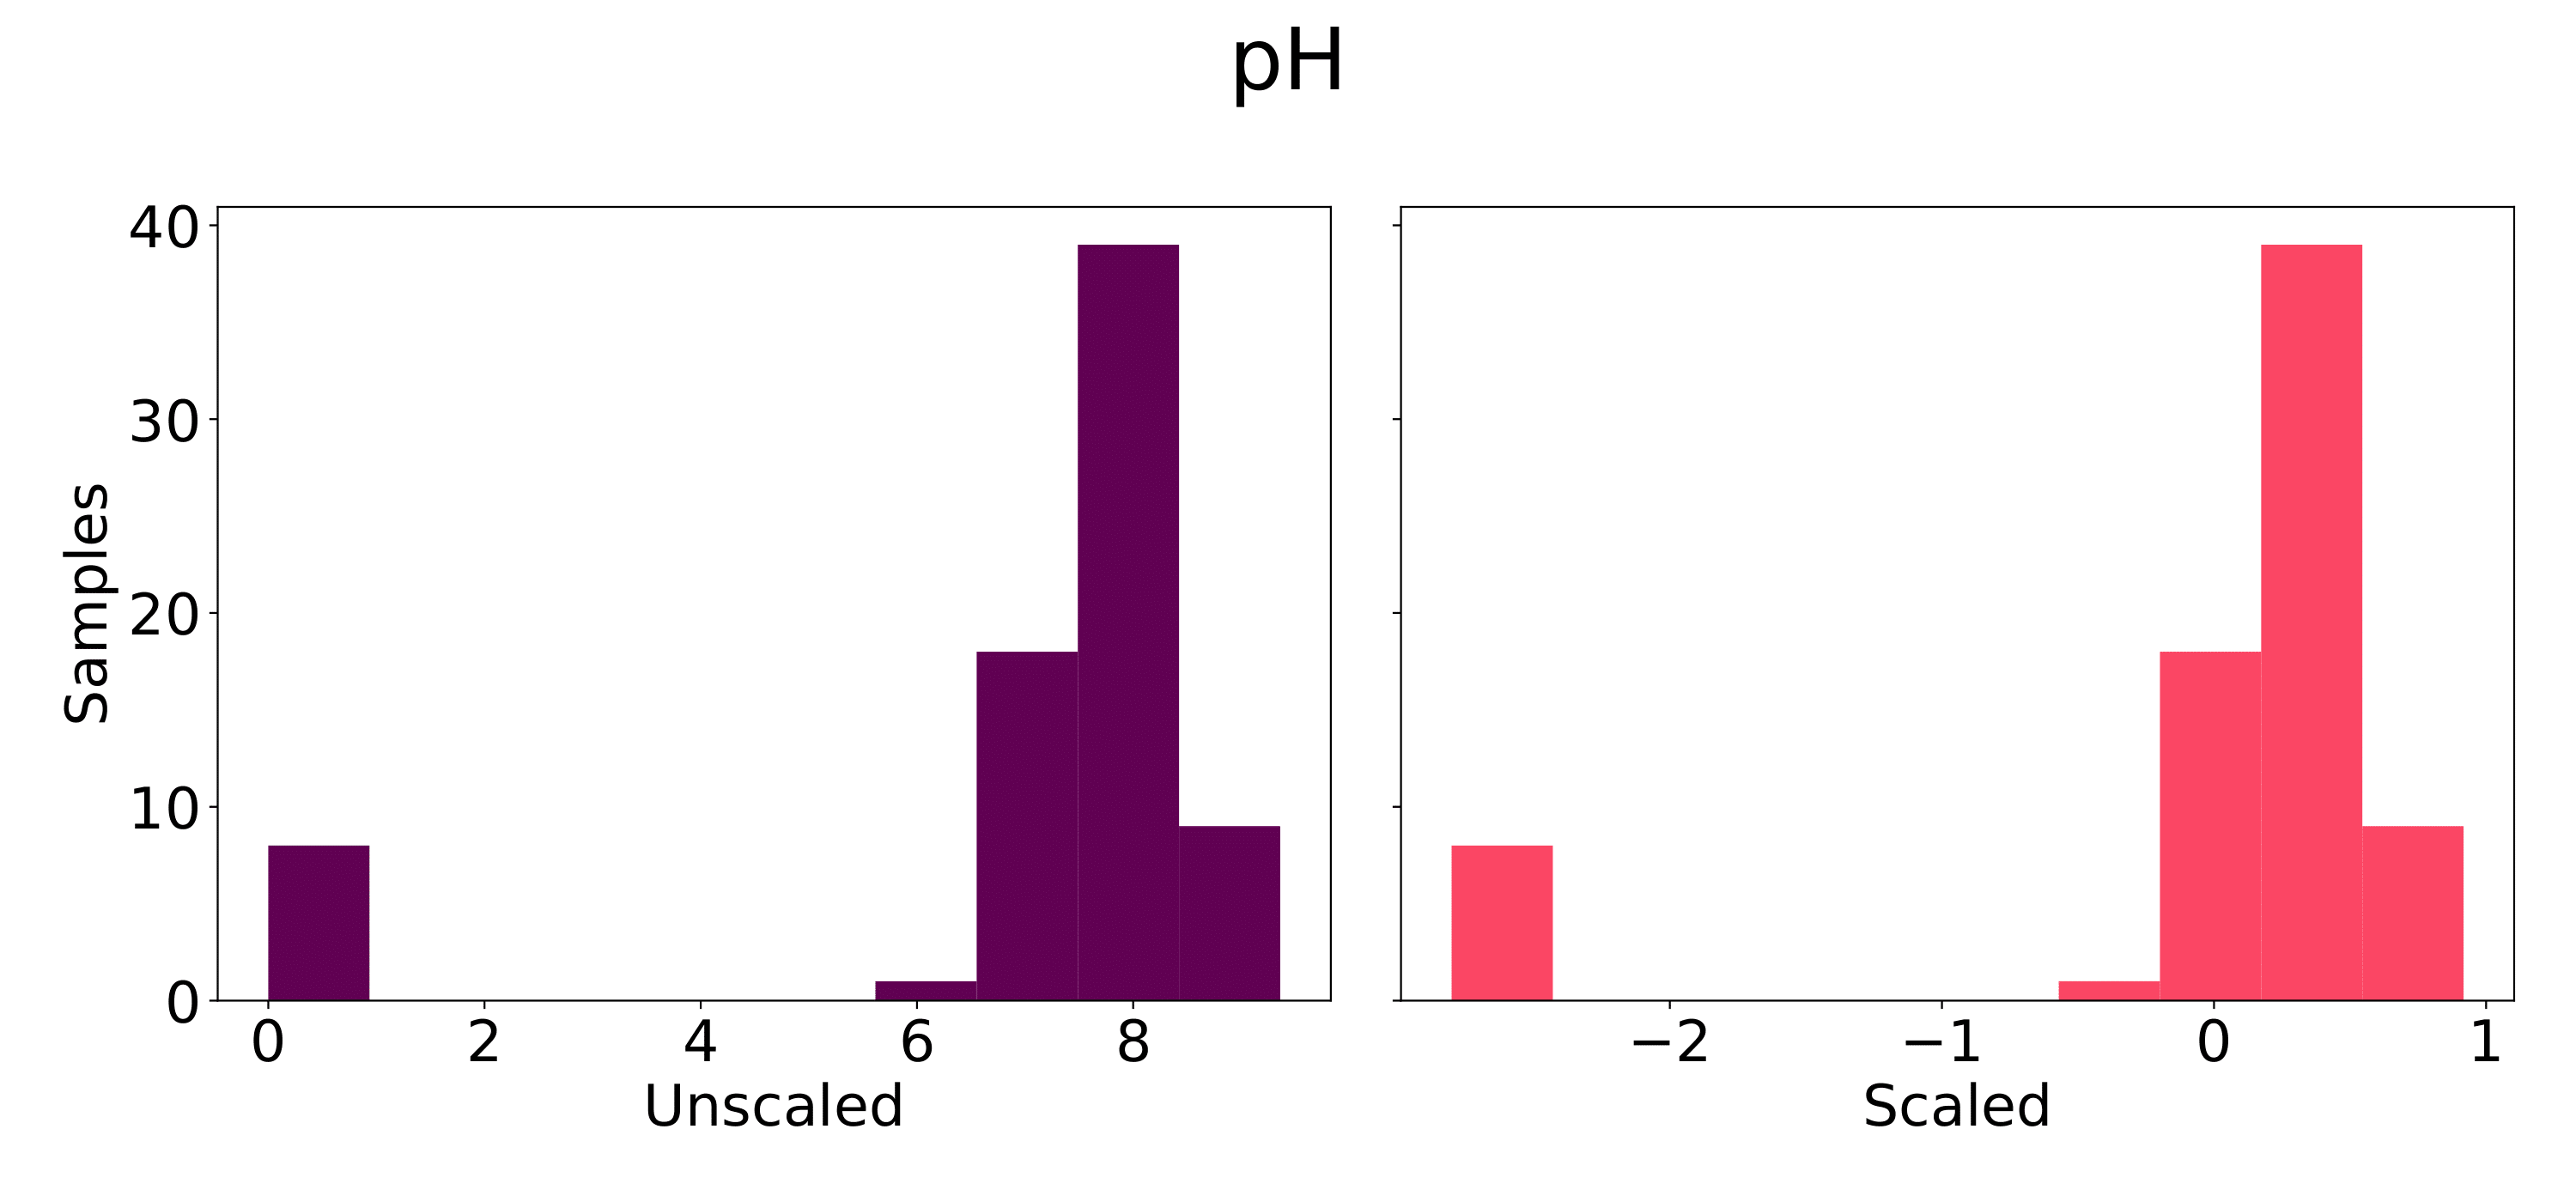
Fig. 2 Soil pH across the 75 samples, before and after scaling. The bulk of the distribution sits between 6 and 9 — alkaline, as expected for this desert. The bar at zero holds the samples whose pH was never recorded.#
Important
Some covariate values are missing and coded as 0, not as blanks. Counted
directly from atacama-selected-covariates-veg.tsv (75 samples):
covariate |
zeros |
plausible as a real value? |
|---|---|---|
|
8 |
No — soil pH of 0 is not physically possible |
|
3 |
Implausible |
|
3 |
Possible at altitude, but suspicious |
|
0 |
— (range 895–4700 m) |
The zeros do not co-occur: none of the humidity-zero or temperature-zero samples
is also a pH-zero sample, so this is per-measurement missingness rather than
eight incomplete records. The eight pH-zero samples are BAQ1370.3, BAQ1552.2,
BAQ895.2, BAQ895.3, YUN1005.2, YUN3008.2, YUN3008.3 and YUN3184.2.
A zero is not neutral. Scaled, those eight samples land at \(-2.80\) — the minimum of the distribution — so a regression that takes them at face value is told that eight sites are far more acidic than any other, when their pH was never recorded. Decide whether to drop those samples, impute them, or exclude pH as a covariate, and state which you did. The tutorials that follow pass the file through unchanged, which demonstrates the commands rather than a treatment of missing data.