Getting Started#
Introduction#
Microbiome data typically contains a large number of microbial features (also called “taxa”) identified in high-throughput sequencing experiments. High-dimensional statistics provides methods tailored to handle the intricacies of microbiome data. These methods assess microbial interactions and unveil patterns that may be indicative of biological phenomena, such as shifts in community composition or associations with specific environmental factors.
Why q2-classo and q2-gglasso?#
QIIME2 has a collection of plugins specifically developed to preprocess raw sequences from high-throughput sequencing datasets, preparing them for downstream analyses. Nevertheless, to conduct advanced statistical analyses on biological samples users often lack “out of the box” options.
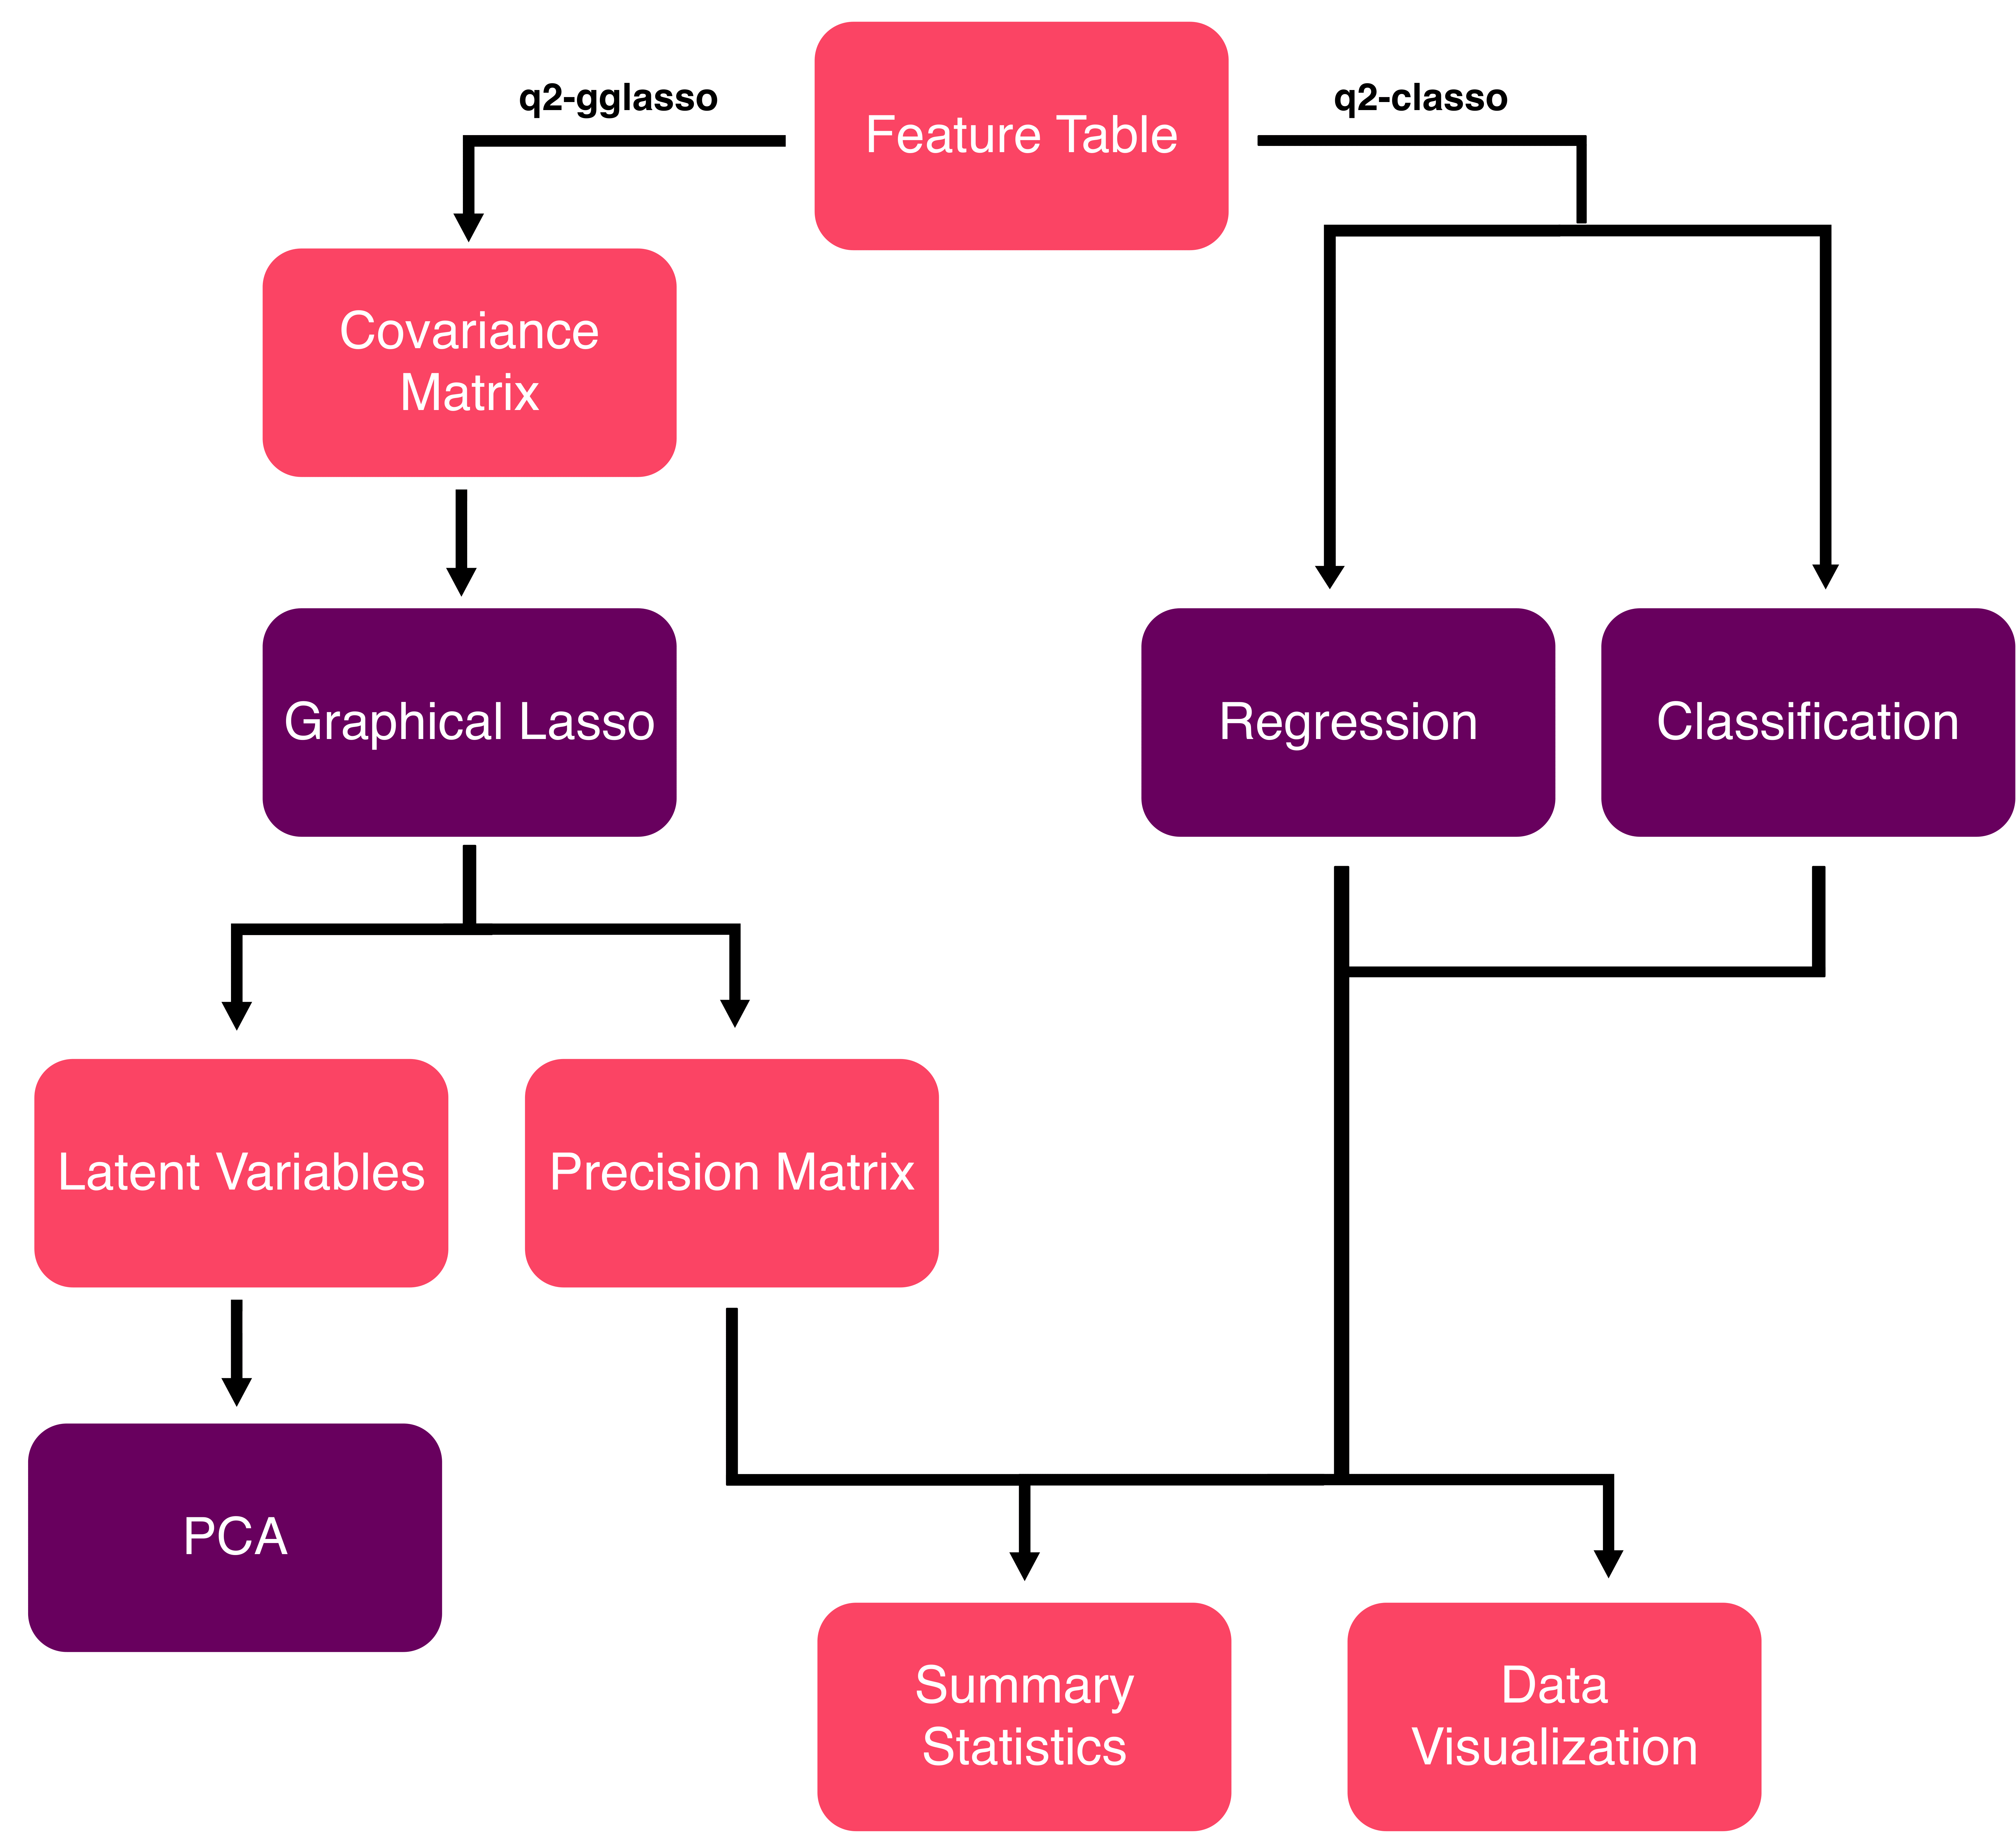
Fig. 1 High-dimensional statistics with QIIME2.#
The pipeline depicted above outlines the functionality implemented in two QIIME2 plugins namely q2-gglasso for network learning and q2-classo for regression and classification tasks. Together, these plugins address gaps in the existing functionality within QIIME2, offering:
Network inference through sparse inverse covariance estimation to identify microbial associations (e.g., discovering which taxa co-occur thin communities)
Sparse log-contrast models for classification and regression tasks (e.g., predicting covariate information, such as disease status or environmental factors, from microbiome data)
Compositionally-aware estimators that properly handle microbiome data constraints and sparsity
Interactive visualizations with publication-ready network graphs and model performance plots
Seamless QIIME2 integration using standard artifact formats and command-line interfaces
What You’ll Learn#
In this documentation, you will learn how to:
Install and set up the q2-gglasso and q2-classo plugins
Apply graphical lasso methods for network inference
Use log-contrast models for regression and classification
Interpret results and create publication-ready visualizations
Integrate these methods into reproducible QIIME2 workflows
Let’s get started with installation and your first analysis!